
Staying ahead in today’s tech landscape means understanding how innovation alerts, Pax tech concepts, smart device advancements, and evolving network architectures connect into one cohesive ecosystem. If you’re searching for clear, actionable insights into emerging technologies—and how to optimize them for real-world performance—this article is built for you.
Here, you’ll get a modern data pipeline overview alongside practical analysis of next-generation device integration, scalable network design, and performance optimization strategies. Instead of surface-level trend reporting, we break down how these technologies function, where they intersect, and what that means for implementation and efficiency.
Our insights are grounded in continuous monitoring of tech innovation cycles, architecture blueprints, and device performance benchmarks. By combining forward-looking concept analysis with practical optimization techniques, this guide helps you move from awareness to execution—so you can adapt faster, build smarter systems, and stay competitive in a rapidly advancing digital environment.
Data no longer trickles; it torrents from sensors, apps, and edge devices. Traditional batch systems buckle under that weight. A modern architecture treats data as a living stream, not a static asset. In this modern data pipeline overview, ingestion layers capture events via APIs and brokers like Kafka, processing engines apply real-time transformations, and cloud-native warehouses surface analytics instantly. What competitors miss is the orchestration layer: metadata tracking, schema evolution, and latency budgets that prevent silent failure. Observability—continuous insight into pipeline health—creates durable advantage. Organizations that optimize flow, not just storage, convert raw signals into measurable revenue faster and growth.
Stage 1: Scalable Data Ingestion and Storage
Every scalable system starts with data ingestion—the process of collecting and importing data for immediate use or storage. I learned this the hard way after building a pipeline that worked beautifully in testing… and collapsed the moment real-time traffic hit (turns out, “it works on my laptop” isn’t a scaling strategy).
There are two primary ingestion models:
- Batch ingestion: Scheduled data transfers at set intervals (think nightly sales reports).
- Stream ingestion: Continuous, real-time data flow from sources like IoT sensors or app activity feeds.
Technologies like Apache Kafka handle streaming by acting as a distributed event log—meaning data is captured and replayable in sequence (like DVR for data). Ignore streaming needs early, and you’ll rebuild everything later. I did.
Once ingested, storage decisions define flexibility. Traditional databases enforce rigid schemas—great for order, terrible for surprise data types.
Data lakes (e.g., Amazon S3, Azure Data Lake Storage) store raw, structured, semi-structured, and unstructured data cheaply. The tradeoff? Without governance, they become “data swamps.”
Data warehouses (e.g., Snowflake, Google BigQuery) store cleaned, structured data optimized for analytics and reporting.
The emerging Lakehouse architecture blends both—offering lake-level flexibility with warehouse-style reliability.
Some argue starting with a warehouse ensures discipline. True—but early rigidity slows experimentation. A balanced modern data pipeline overview typically favors lake-first flexibility with layered structure.
Pro tip: Design for growth, not perfection. Refactoring storage mid-scale is far more painful than over-preparing early.
Stage 2: The Processing Engine – Transforming Raw Data
As organizations navigate the complexities of modern data pipelines, leveraging tools like Oxzep7 can significantly enhance the efficiency of data collection and analysis, making insights more accessible than ever – for more details, check out our Upgrade Oxzep7 Python.
Once data is collected, the real magic begins. Stage 2 is where raw inputs—often messy, duplicated, or incomplete—are refined into something usable. Think of it as the difference between crude oil and gasoline (same source, wildly different value).
Batch vs. Stream Processing
First, batch processing. This model handles large volumes of stored data at scheduled intervals. Using frameworks like Apache Spark, teams crunch terabytes at once—ideal for end-of-day financial reports, historical trend analysis, or training machine learning models. It’s efficient and cost-effective. However, critics argue it’s too slow for today’s real-time expectations—and they’re not wrong if immediacy is mission-critical.
On the other hand, stream processing analyzes data the moment it’s generated. Tools like Apache Flink or ksqlDB process events in motion, powering fraud detection, IoT monitoring, and live dashboards. When a bank flags a suspicious transaction in milliseconds, that’s stream processing at work. The tradeoff? Greater architectural complexity (and usually higher operational demands).
So what’s next—do you choose one? Increasingly, organizations combine both in a modern data pipeline overview, blending reliability with responsiveness.
The ELT Model
Then there’s ELT—Extract, Load, Transform. Unlike traditional ETL, which transforms data before loading, ELT stores raw data first and reshapes it inside the warehouse. This provides flexibility: if business logic changes, you don’t need to re-extract everything. Pro tip: keep raw data immutable whenever possible; future use cases often surprise you.
Naturally, the next question becomes scalability. As volumes grow, can your processing engine evolve without bottlenecks?
Stage 3: Serving and Visualizing Actionable Intelligence
At this stage, the analytics layer turns processed data into usable insight. End-users access curated datasets through SQL queries, APIs (application programming interfaces that let systems talk to each other), and Business Intelligence (BI) tools. According to Gartner, organizations that invest in self-service analytics are 2x more likely to outperform peers in decision-making speed. In other words, access matters.
However, raw query results alone rarely inspire action. That’s where visualization platforms like Tableau and Power BI step in. They convert dense tables into dashboards, trend lines, and heat maps that tell a story. A McKinsey study found that companies using data visualization extensively are 28% more likely to find timely insights. Numbers become narratives (and yes, a clean dashboard can feel as satisfying as a perfectly organized playlist).
Meanwhile, this refined data fuels machine learning. Clean inputs improve model accuracy—IBM reports that poor data quality costs businesses $3.1 trillion annually in the U.S. alone. Better data, better predictions.
Finally, operational analytics feeds insights back into systems to automate decisions—like inventory restocking or fraud detection—closing the loop described in a modern data pipeline overview in the section. For deeper technical context, see breaking down blockchain technology for beginners.
The Unseen Framework: Orchestration and Governance
Behind every modern data pipeline overview sits orchestration and governance. Workflow orchestration—tools like Apache Airflow or Prefect that schedule, trigger, and monitor tasks—keeps pipelines from breaking at 2 a.m. For example, set dependencies so transformation runs only after validation passes; then add alerts to Slack for failures.
Equally important, data governance defines rules for accuracy, access, and compliance. Create role-based permissions, automate quality checks, and document data owners. (If everyone owns the data, no one does.)
Finally, implement data cataloging and lineage. Track where datasets originate, how they’re transformed, and who queries them. When dashboards look wrong, lineage graphs cut debugging time in half. Pro tip: review lineage monthly to catch silent schema drift. This prevents costly compliance surprises.
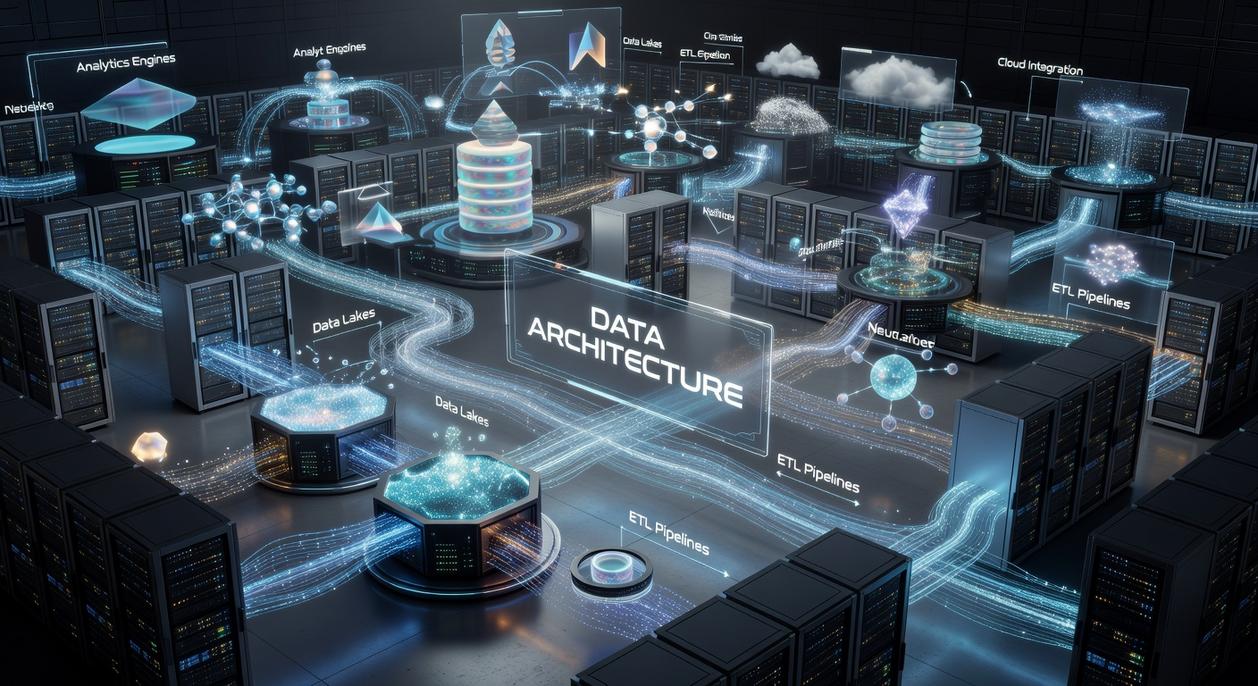
Building a future-proof and optimized data architecture starts with four core stages: ingest, store, process, and analyze. Together, they form a modular, interconnected system where data flows like a relay race rather than a traffic jam (because bottlenecks kill momentum). Ingest captures raw signals; storage preserves them; processing refines them; analytics turns them into decisions. Decoupling is the advantage competitors overlook. Instead of one monolith, specialized tools remain interchangeable, reducing vendor lock-in and upgrade risk. Below is a modern data pipeline overview.
| Stage | Purpose |
| Ingest | Capture |
| Store | Retain |
| Process | Transform |
| Analyze | Insight |
Future-proofing means evolving with new networks and devices, not chasing single platforms. Pro tip: design for replaceability.
Turn Your Data Into a Competitive Advantage
You came here looking for clarity on how a modern data pipeline overview fits into today’s fast-moving tech environment—and now you have it. You understand how data flows, where bottlenecks happen, and why optimization is the difference between lagging behind and leading innovation.
The reality is this: fragmented systems, slow processing, and poor visibility cost you time, performance, and opportunity. In a world driven by smart devices, connected networks, and real-time insights, inefficiency isn’t just frustrating—it’s expensive.
Now it’s time to act. Audit your current pipeline, identify weak integration points, and implement smarter automation and architecture upgrades. Don’t let outdated infrastructure throttle your growth.
If you want proven innovation alerts, cutting-edge Pax tech concepts, and actionable optimization hacks trusted by forward-thinking tech leaders, start implementing these strategies today and stay ahead of the curve. The next breakthrough belongs to those who optimize first.